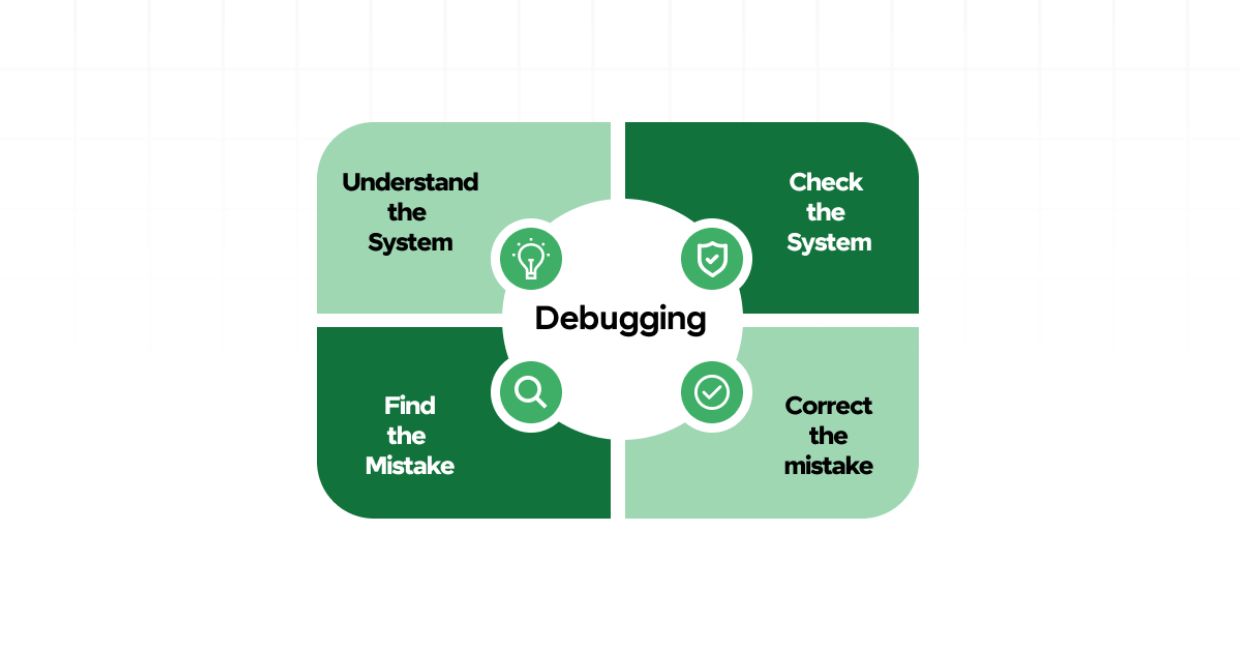
Debugging is an essential skill for every programmer, especially for those working with JavaScript. As a beginner, you might often find yourself running into errors in your code, whether it’s a syntax error, reference error, or logical issue. The process of fixing these errors, known as debugging, can be overwhelming if you’re not familiar with the tools and techniques available. Fortunately, JavaScript offers many powerful tools and strategies to help you identify and resolve issues more efficiently.
In this article, we will walk through key debugging tips and techniques for beginners to help you become more confident in resolving JavaScript issues. We’ll cover everything from the basics of debugging to more advanced strategies used by experienced developers.
Common JavaScript Errors and How to Fix Them
1. Understand Common JavaScript Errors
Before diving into debugging techniques, it’s crucial to familiarize yourself with the most common JavaScript errors. Understanding the types of errors that occur will help you quickly identify the root cause of issues in your code.
Syntax Errors
Syntax errors occur when the structure of the code is incorrect. This can include missing brackets, parentheses, or quotation marks. These errors will usually prevent your script from running.
Example:
console.log("Hello World); // Missing closing quote
Reference Errors
A reference error occurs when you try to use a variable or function that has not been declared or defined.
Example:
console.log(myVariable); // Uncaught ReferenceError: myVariable is not defined
Type Errors
A type error happens when an operation is performed on a value that is not of the expected type, such as calling a string method on a number.
Example:
let num = 5;
num.toUpperCase(); // Uncaught TypeError: num.toUpperCase is not a function
Logic Errors
Logic errors are more subtle and occur when the program runs without any syntax or reference issues, but the behavior is not what you expect. These can be harder to identify, as they don’t cause the program to fail immediately.
2. Use console.log() for Debugging
One of the most fundamental tools for debugging in JavaScript is console.log(). By printing values to the browser’s console, you can check the state of variables and understand the flow of your program.
Basic Usage:
let a = 5;
let b = 10;
console.log(a + b); // Output: 15
Log Variable Values:
Logging variables at different points in your code can help you understand their values at runtime.
let name = "John";
console.log("Before change: ", name);
name = "Jane";
console.log("After change: ", name);
Log Objects and Arrays:
When dealing with objects or arrays, logging their structure can provide insights into what’s happening inside them.
let person = { name: "John", age: 30 };
console.log(person);
3. Break Down Your Code into Smaller Chunks
If you’re facing difficulties debugging a large block of code, it’s a good idea to break your code into smaller, manageable chunks. By isolating sections of your code and testing them independently, you can better identify where the problem lies.
Example:
Instead of writing one large function, break it down:
function calculateSum(a, b) {
    console.log(a, b); // Debugging output
    return a + b;
}

let result = calculateSum(5, 10);
console.log(result); // Check the result
4. Leverage Browser Developer Tools
Modern browsers like Chrome, Firefox, and Edge come with built-in developer tools that offer advanced debugging features. These tools allow you to inspect elements, track network activity, monitor performance, and even step through your JavaScript code.
Using the Console:
The Console tab in developer tools is an essential resource for debugging JavaScript. You can see the output of console.log(), view errors, and even run JavaScript directly in the browser console.
Using the Sources Tab:
The Sources tab allows you to debug your JavaScript step-by-step using breakpoints. A breakpoint pauses the execution of the code, allowing you to inspect variables and execution flow.
Steps to Set Breakpoints:
- Open Developer Tools (press
F12orCtrl + Shift + I). - Go to the Sources tab.
- Find your JavaScript file.
- Click on the line number where you want to set a breakpoint.
Now, when the code execution reaches that line, it will pause, and you can inspect the call stack, variables, and other details.
5. Check the Stack Trace
When an error occurs in JavaScript, the browser usually provides a stack trace in the console. This trace shows the sequence of function calls that led to the error. Analyzing the stack trace can help you pinpoint where the error occurred and which function caused it.
Example of a Stack Trace:
Uncaught TypeError: Cannot read property 'toUpperCase' of undefined
    at greet (app.js:5)
    at app.js:9
In this example, the error occurred in the greet() function on line 5. The stack trace tells you exactly where to look for the problem.
6. Use Debugger Statements
The debugger statement is a powerful tool in JavaScript that pauses the execution of the script at the point where the debugger statement appears. You can then inspect the values of variables and the execution flow just like with breakpoints in browser developer tools.
Example:
function multiply(a, b) {
    debugger; // Execution will pause here
    return a * b;
}

let result = multiply(5, 10);
console.log(result);
When the code runs, it will pause at the debugger line, and you can inspect the current state.
7. Try console.trace() for Function Call Tracing
If you’re having trouble figuring out how your code is reaching a certain point, you can use console.trace() to print a stack trace to the console. This helps you trace how a function was called and what led to the current state.
Example:
function outer() {
    inner();
}

function inner() {
    console.trace();
}

outer(); // This will log a stack trace
8. Handle Errors Gracefully with try-catch
A try-catch block is a good way to handle errors without interrupting the entire program. By wrapping your code in a try-catch block, you can catch any errors that occur and log them or handle them appropriately.
Example:
try {
    let result = riskyFunction();
    console.log(result);
} catch (error) {
    console.log("An error occurred: ", error.message);
}
The catch block will handle any errors that happen in the try section, allowing the program to continue running.
9. Test Your Code with Unit Tests
Writing unit tests is an excellent way to prevent bugs from entering your code in the first place. Unit tests allow you to test small, isolated pieces of functionality to ensure that each part of your application is working correctly.
You can use testing frameworks like Jest or Mocha to write and run unit tests for your JavaScript code. These tests can help you catch issues early in development, making debugging much easier.
Example of a Simple Unit Test with Jest:
function add(a, b) {
    return a + b;
}

test('adds 1 + 2 to equal 3', () => {
    expect(add(1, 2)).toBe(3);
});
10. Use Online Debugging Tools
Several online tools allow you to debug your JavaScript code directly in the browser. These tools can be helpful when you don’t want to set up a local development environment.
Some popular online debuggers include:
- JSFiddle (https://jsfiddle.net/)
- CodePen (https://codepen.io/)
- Repl.it (https://replit.com/)
These platforms let you write and test JavaScript code in an isolated environment, making it easier to debug specific parts of your code.
11. Learn to Read and Interpret Error Messages
As you encounter errors in JavaScript, it’s important to learn how to interpret the error messages. JavaScript provides helpful information about the type of error and the line where it occurred. Understanding these messages will make it easier for you to identify the problem and fix it.
For example:
- ReferenceError means you’re trying to use a variable that doesn’t exist.
- TypeError indicates you’re trying to perform an operation on an invalid type.
- SyntaxError points to a mistake in the structure of your code, like missing parentheses or brackets.
Conclusion
Debugging is a vital skill for JavaScript developers, and the sooner you become comfortable with the process, the more confident you’ll be in writing clean, bug-free code. As a beginner, it’s important to understand common errors, use tools like console.log() and browser developer tools, break your code into smaller chunks, and learn how to interpret stack traces. Additionally, employing strategies like unit testing, error handling with try-catch, and using debugger statements will help you identify and resolve issues efficiently.
By mastering these JavaScript debugging tips, you’ll not only improve your coding skills but also enhance the overall quality of your projects. Happy coding!